Welcome!
This site serves as a companion to the SPARTIN R package, which is available to download from github. You can use the "ExportToVis" function to export a tessellation generated by the SPARTIN package to a format that can be visualized by this webapp. For a more detailed tutorial on how to use the package, you can read the "SPARTIN-General-Usage" vignette available in the package.
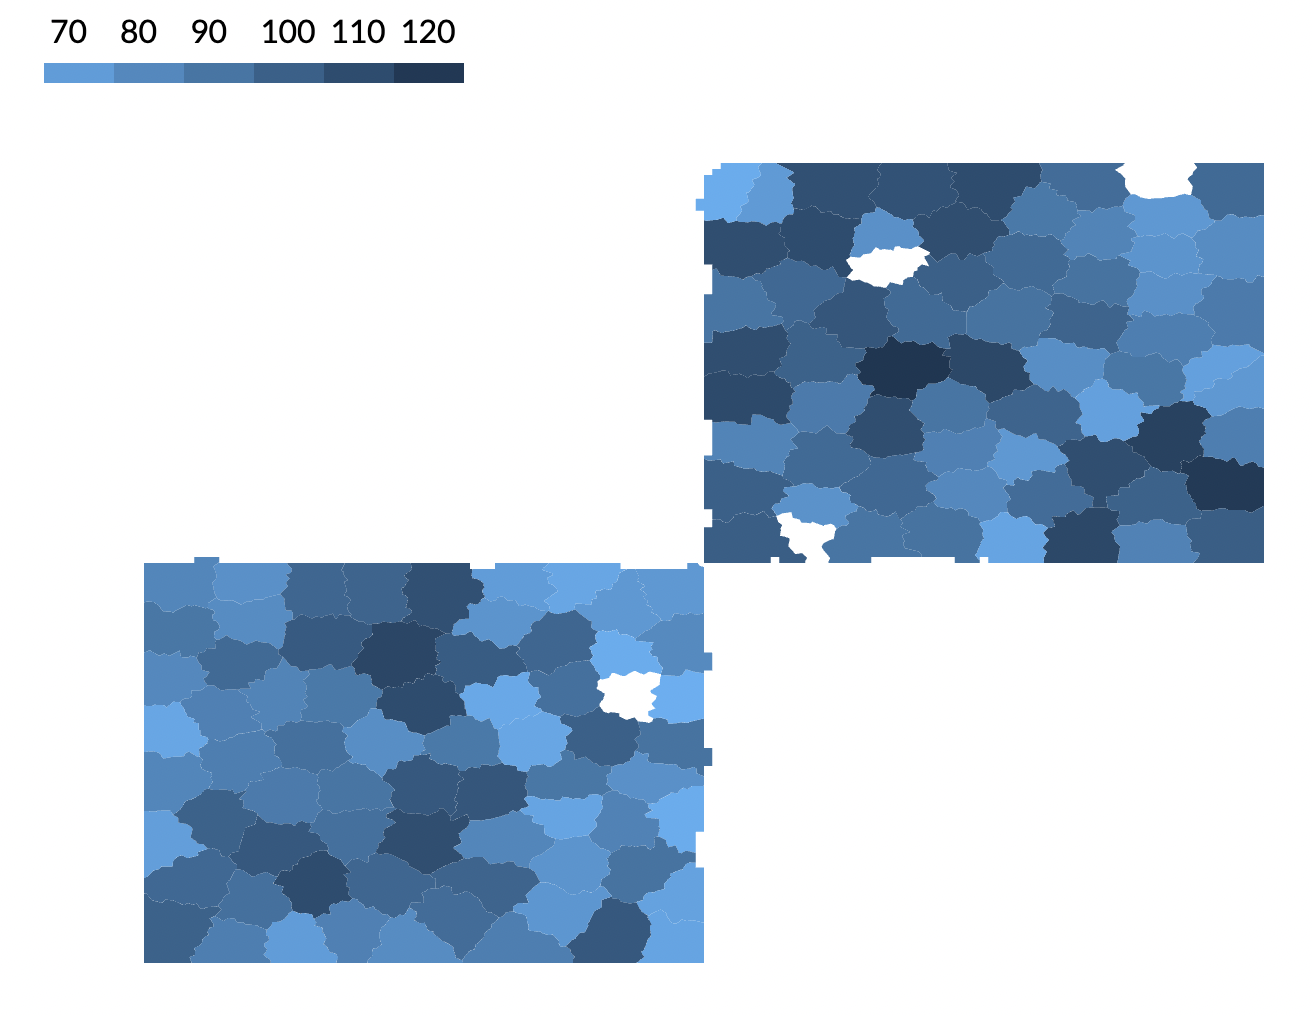
To use the visualizer, go the the "Visualizer" page by using the link in the navbar above. After uploading a json file outputted by the "ExportToVis" function, you should see a heatmap generated like this one:
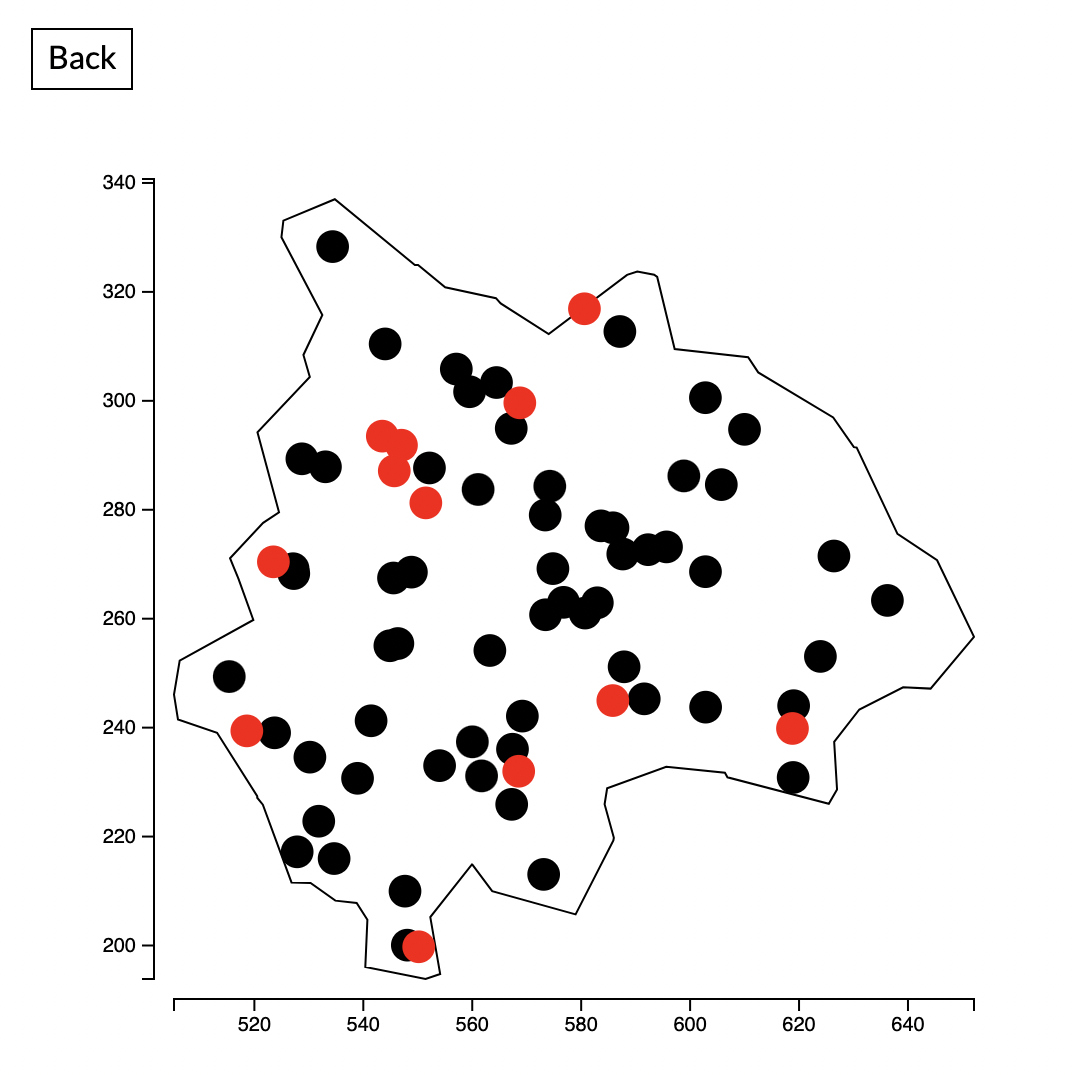
Clicking on tiles enlarges them to show the position of the points:
If you'd like to see the visualizer in action but don't yet have any data to test it on, you can use this sumulated data set to explore the functionality of the visualizer.
Questions? Bug Reports? Just want to chat? Feel free to email me: oshern [at symbol] umich [dot] edu.